Know what's running, what's wrong, and what's changing
One view for errors, silent failures, behavioral drift, and AI cost — across every automation and agent Floxer sees.
See it in your workspace
Real Floxer UI, not decorative mockups.
Nothing to configure by hand
Point your platform's OpenTelemetry exporter at Floxer and it takes it from there. Floxer automatically discovers automations and agents from the telemetry it receives — no manual setup, no naming things yourself.
- Sources and Automations detected from telemetry, automatically
- Recognised across restarts and redeploys — same instance stays one Source
- Unrecognised telemetry is still captured, never silently dropped
Northwind n8n Cloud
Source detected · first seen 12 days ago
Plain health, not a wall of traces
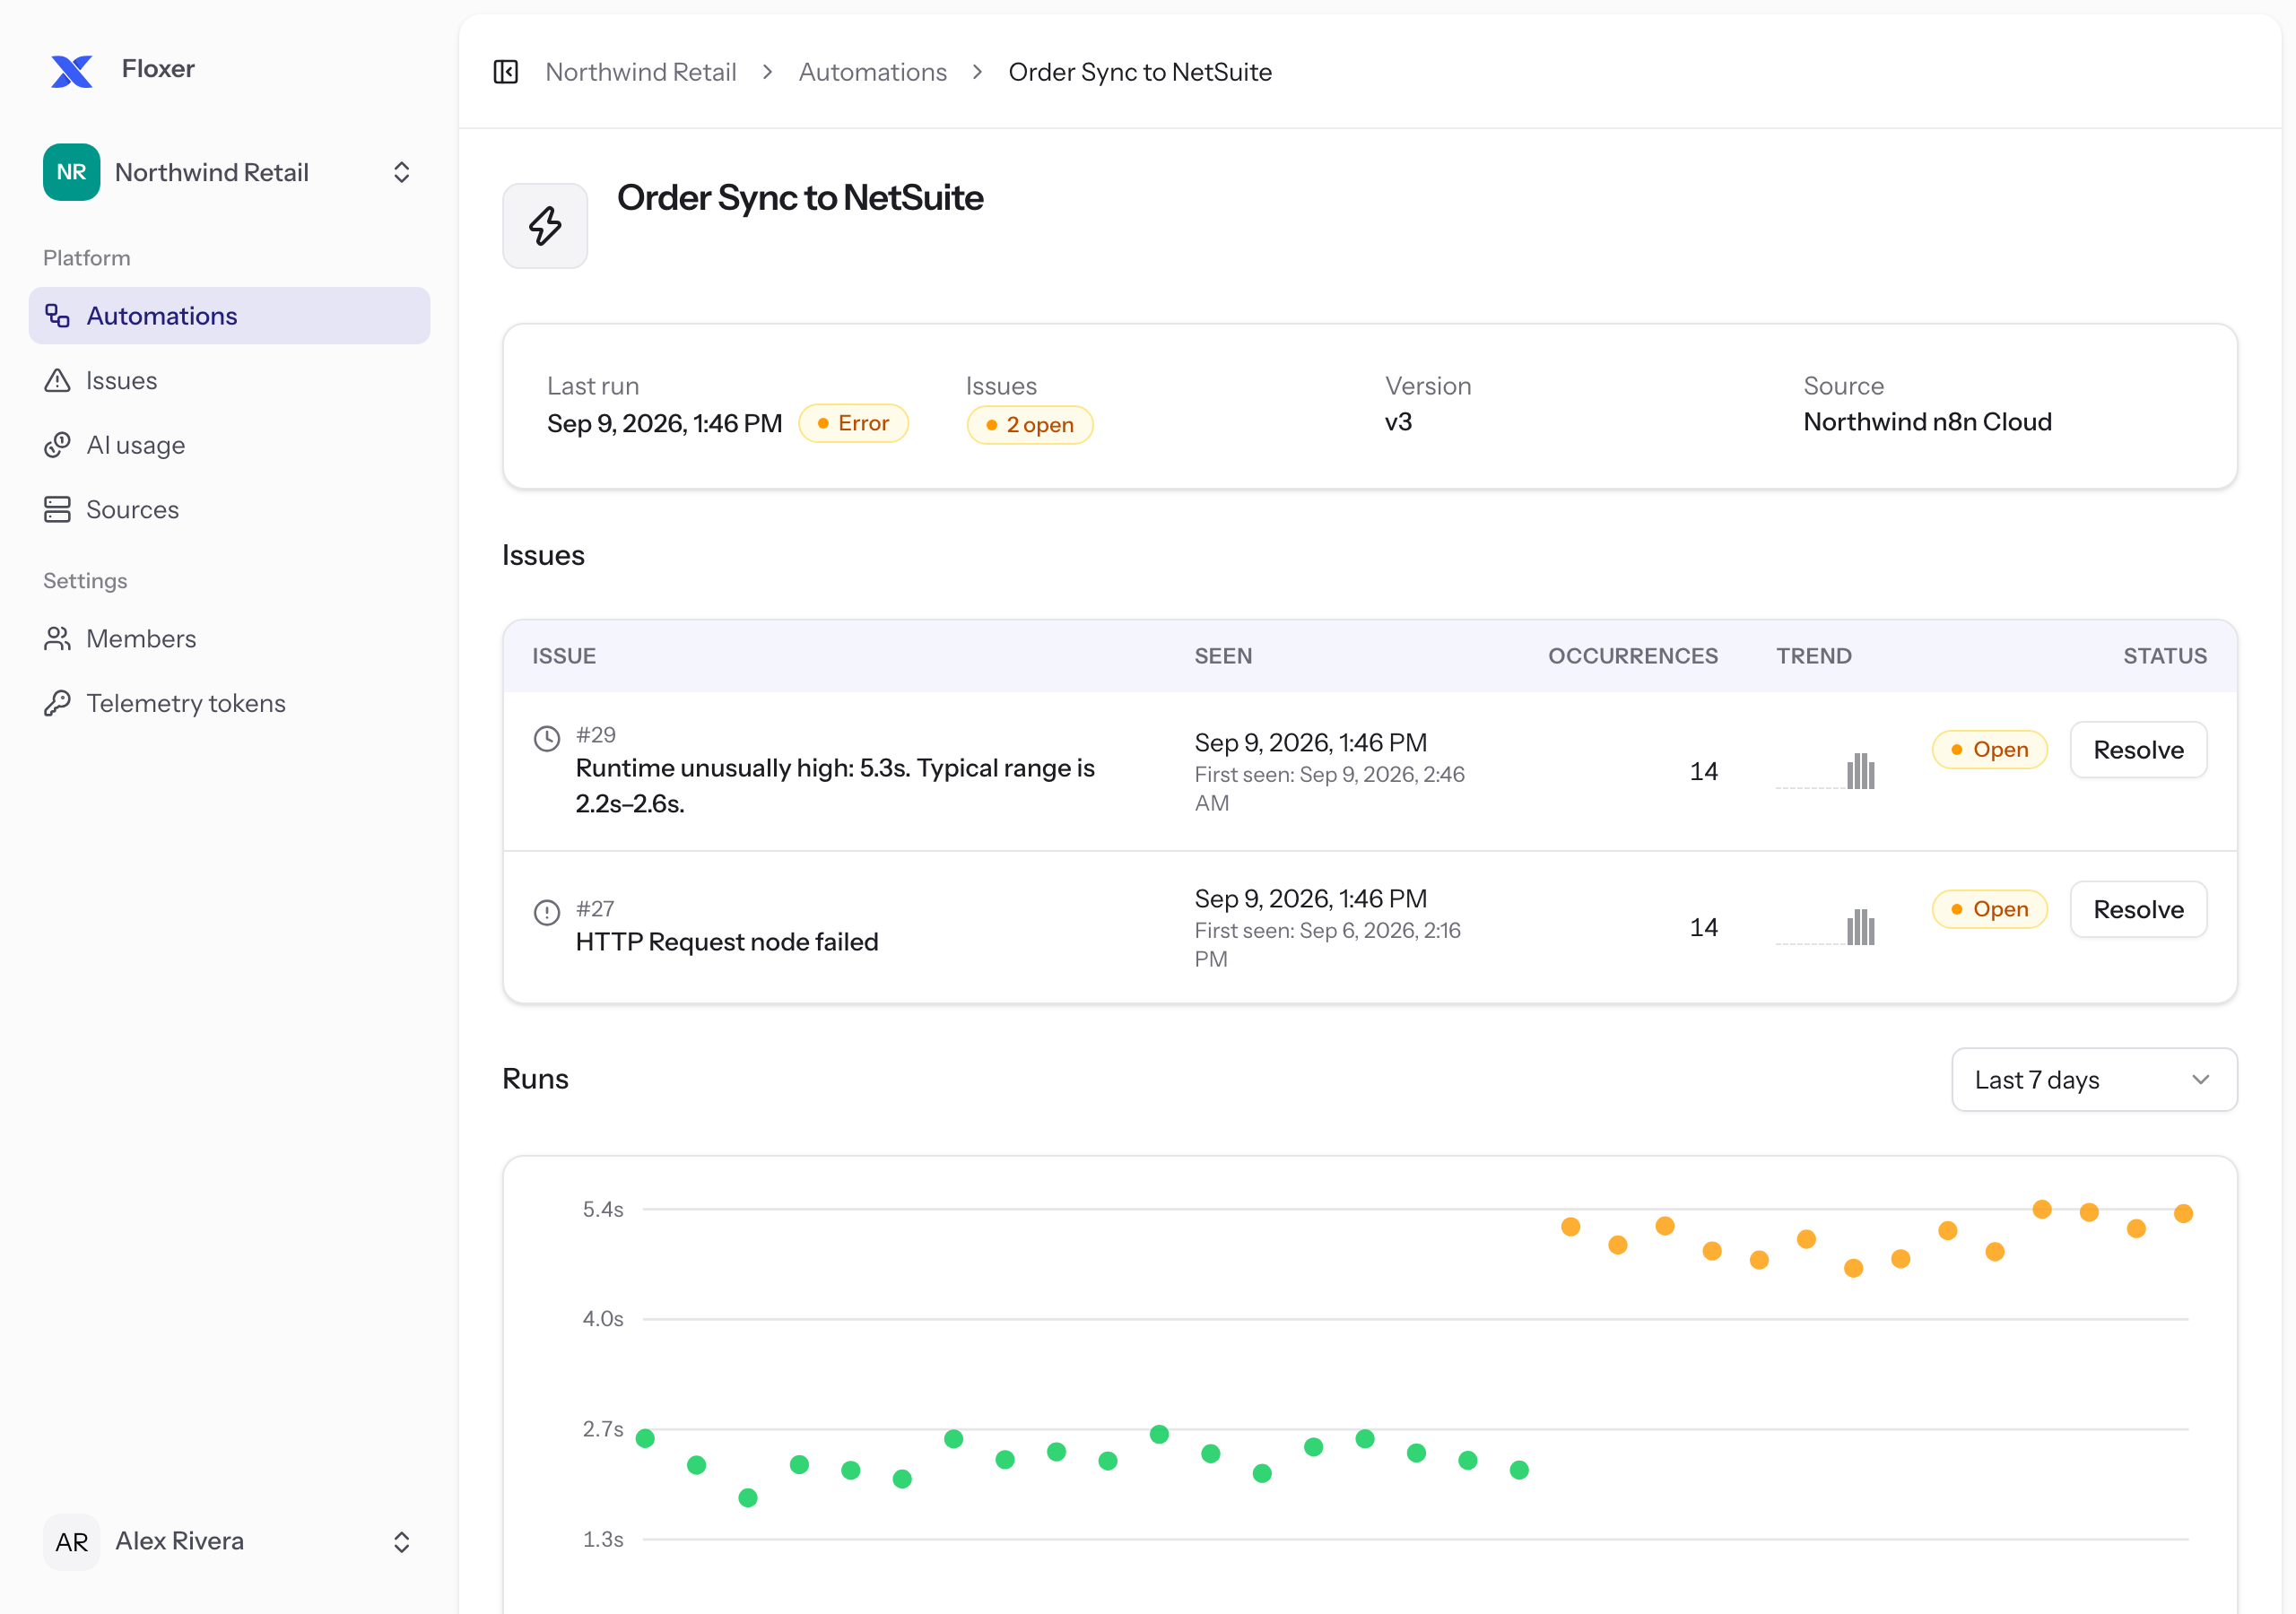
Every Automation shows one of three states: Healthy, Needs attention, or Silent. When a problem keeps recurring, Floxer groups every occurrence into a single Issue with a stable fingerprint — not a new alert for every single failure.
- Three-state health: Healthy, Needs attention, Silent
- Issues grouped by fingerprint, with occurrence count and first/last seen
- Resolve an Issue, and reopen it if it comes back
14 occurrences · first seen 3 days ago · last seen 20 minutes ago
Know what your AI agents are costing you
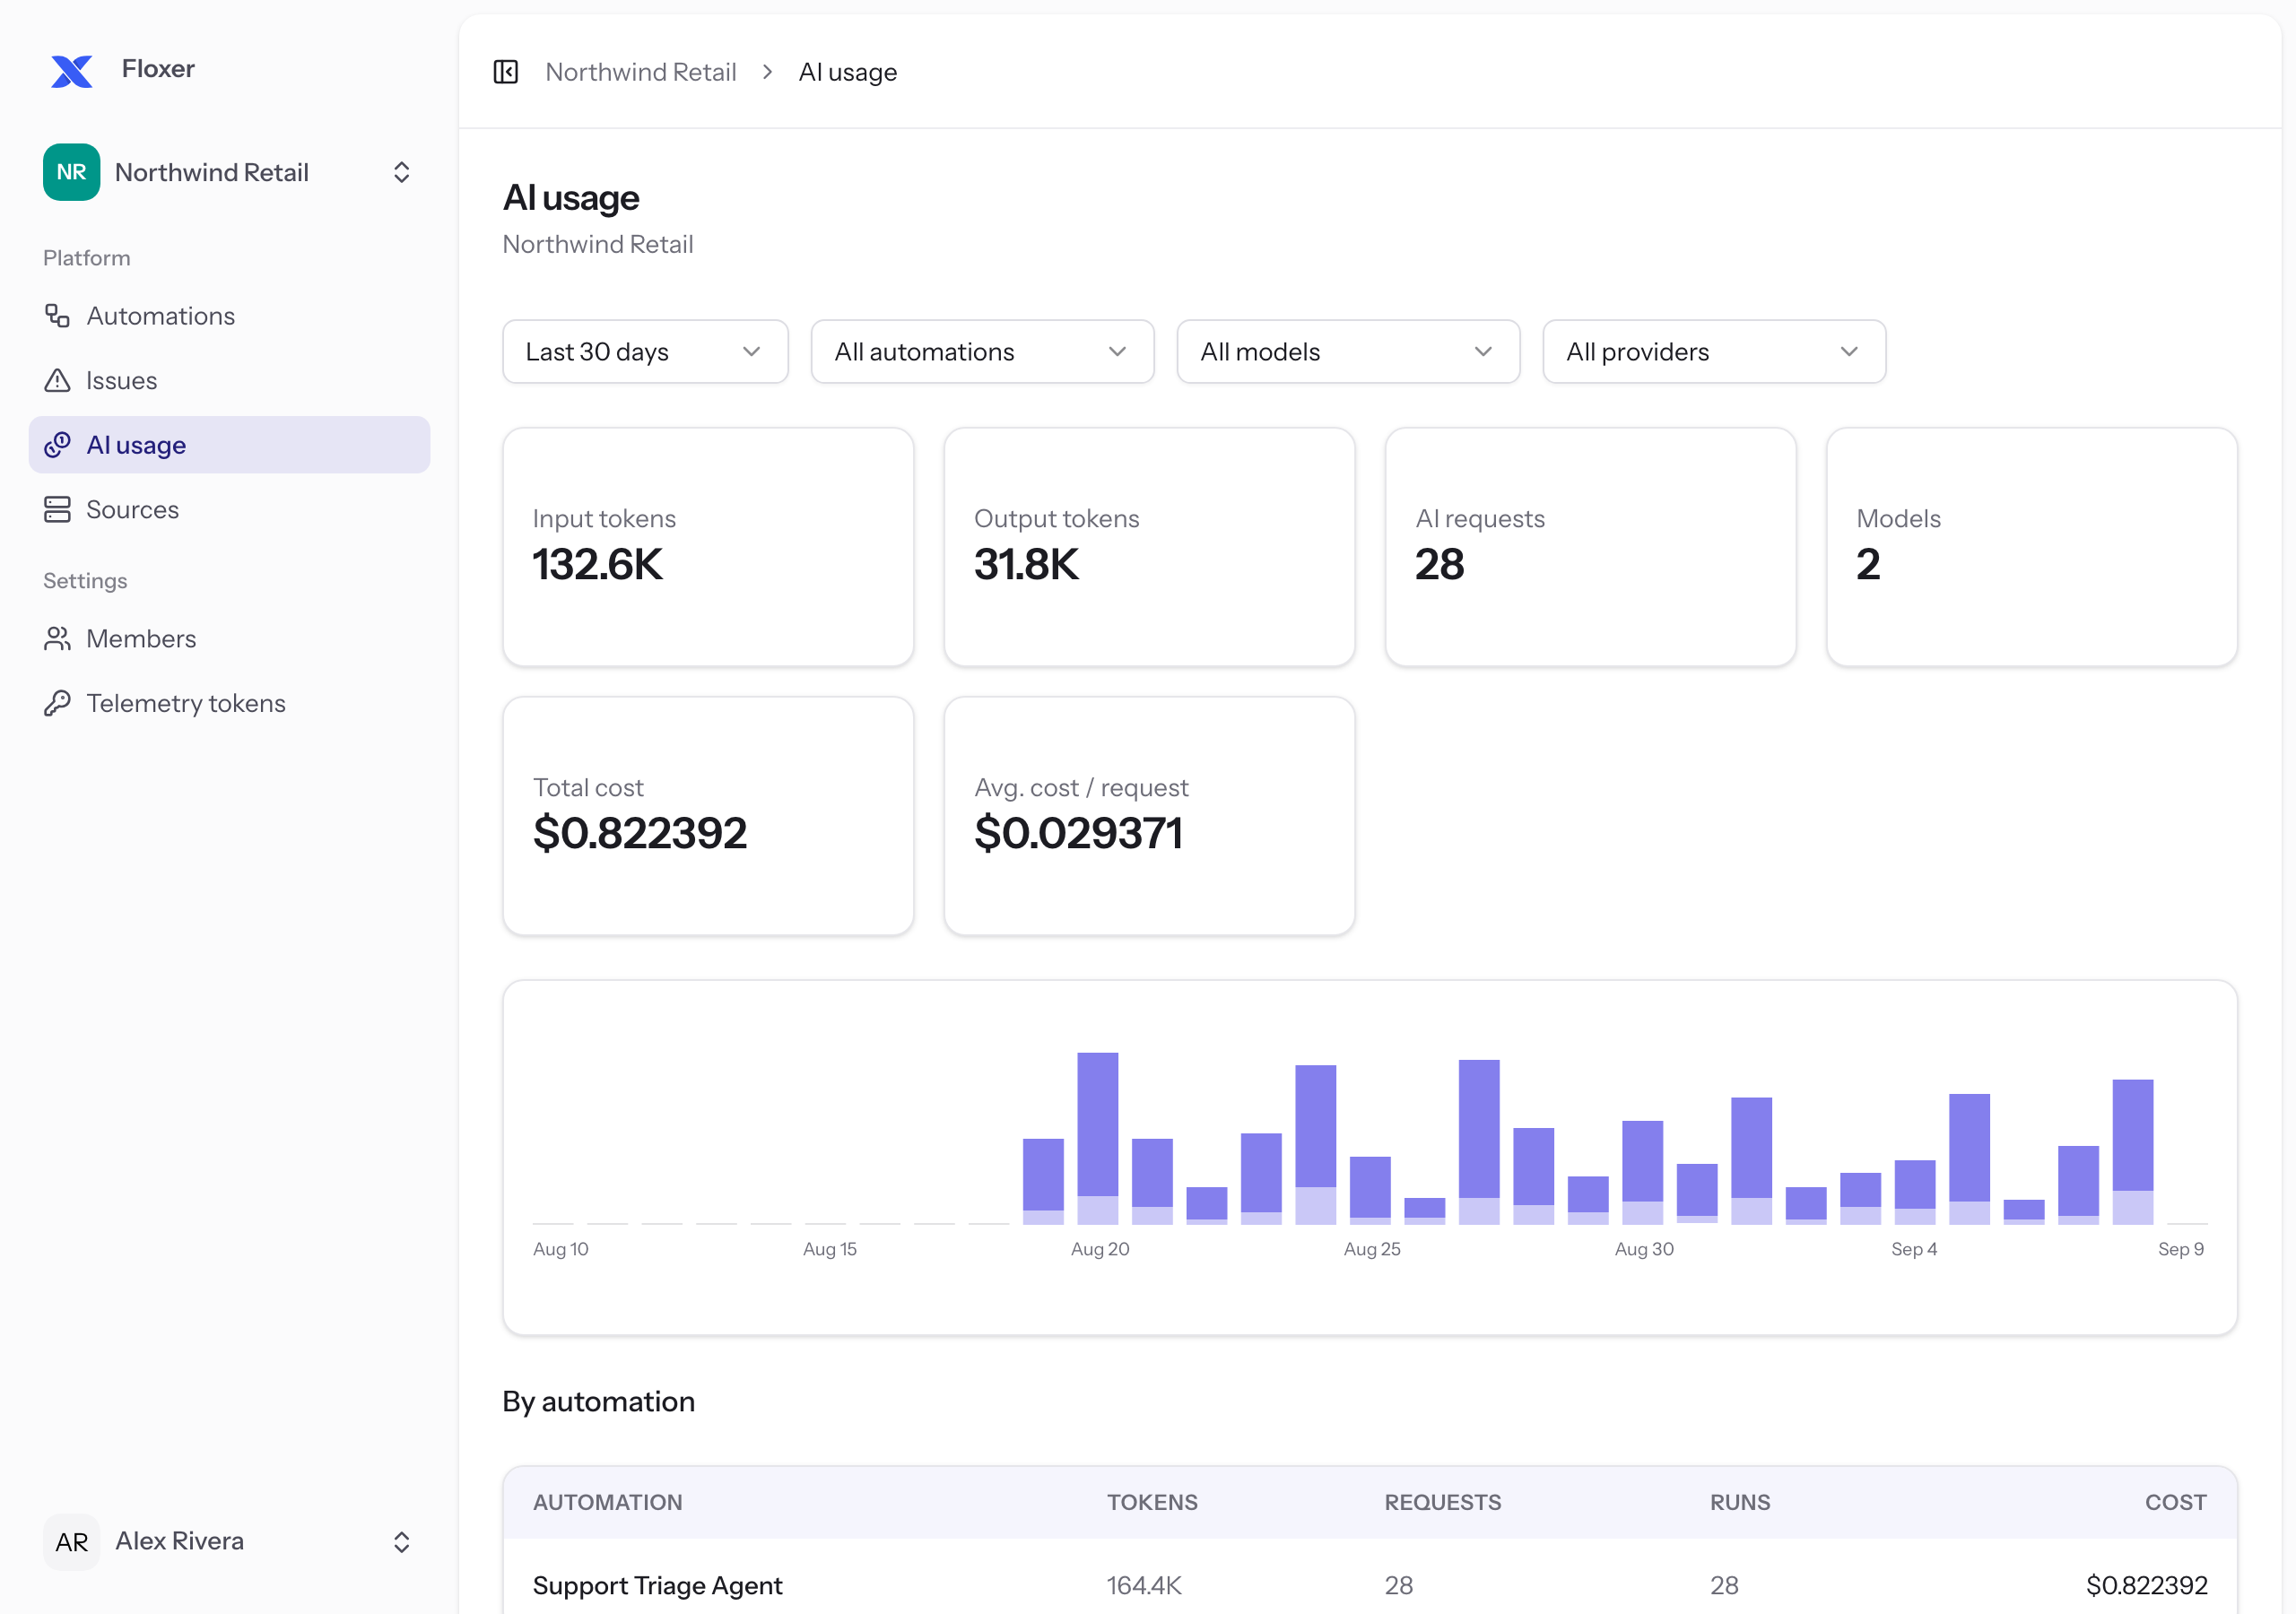
Every AI/model call inside an automation is tracked as its own event — tokens in, tokens out, and cost, broken down by model, provider, and automation. See it on the automation itself, on a single run, or rolled up workspace-wide.
- Input/output tokens, requests, and cost per model and provider
- Reported cost when the platform provides it, estimated when it doesn't
- Break down by automation to see which agent is actually expensive
Catches drift, not just crashes
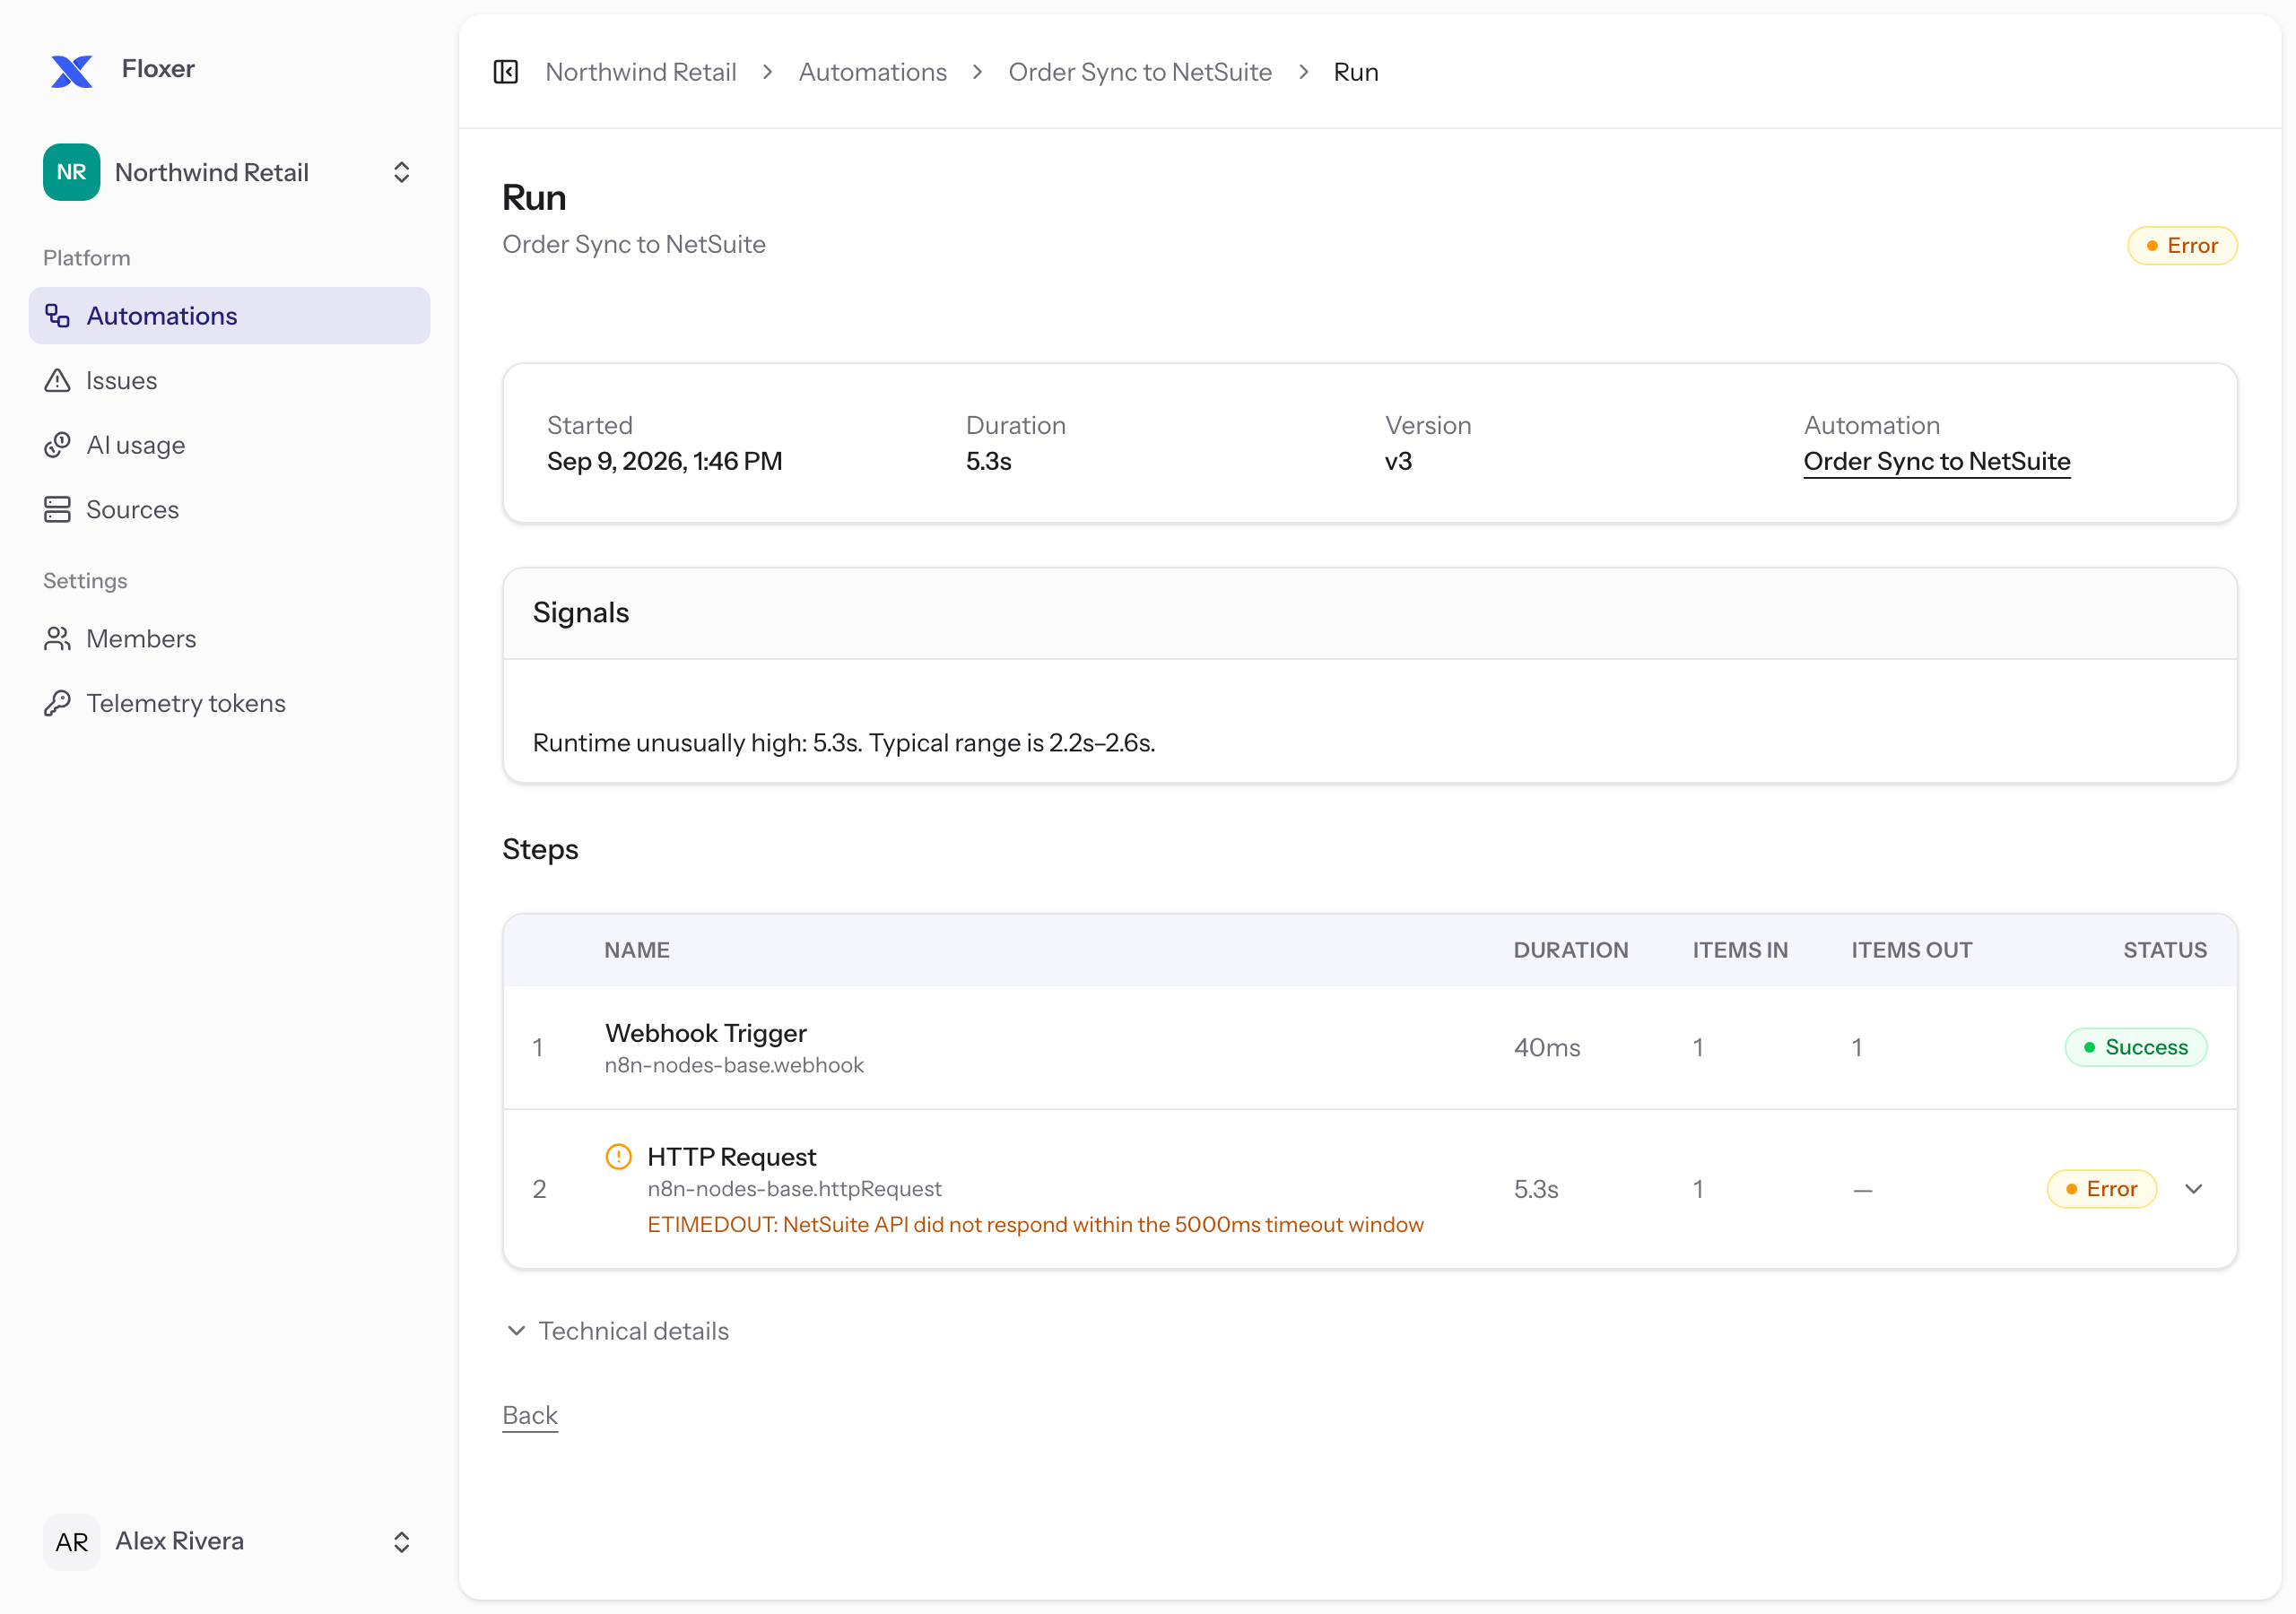
Floxer builds a rolling baseline for each Automation's normal runtime, item counts, and cadence — then flags a recurring pattern of deviation as a Signal, before it becomes a hard failure. A single unusual run is never enough on its own; only a sustained shift is.
- Detects when an automation got slower, or started erroring more
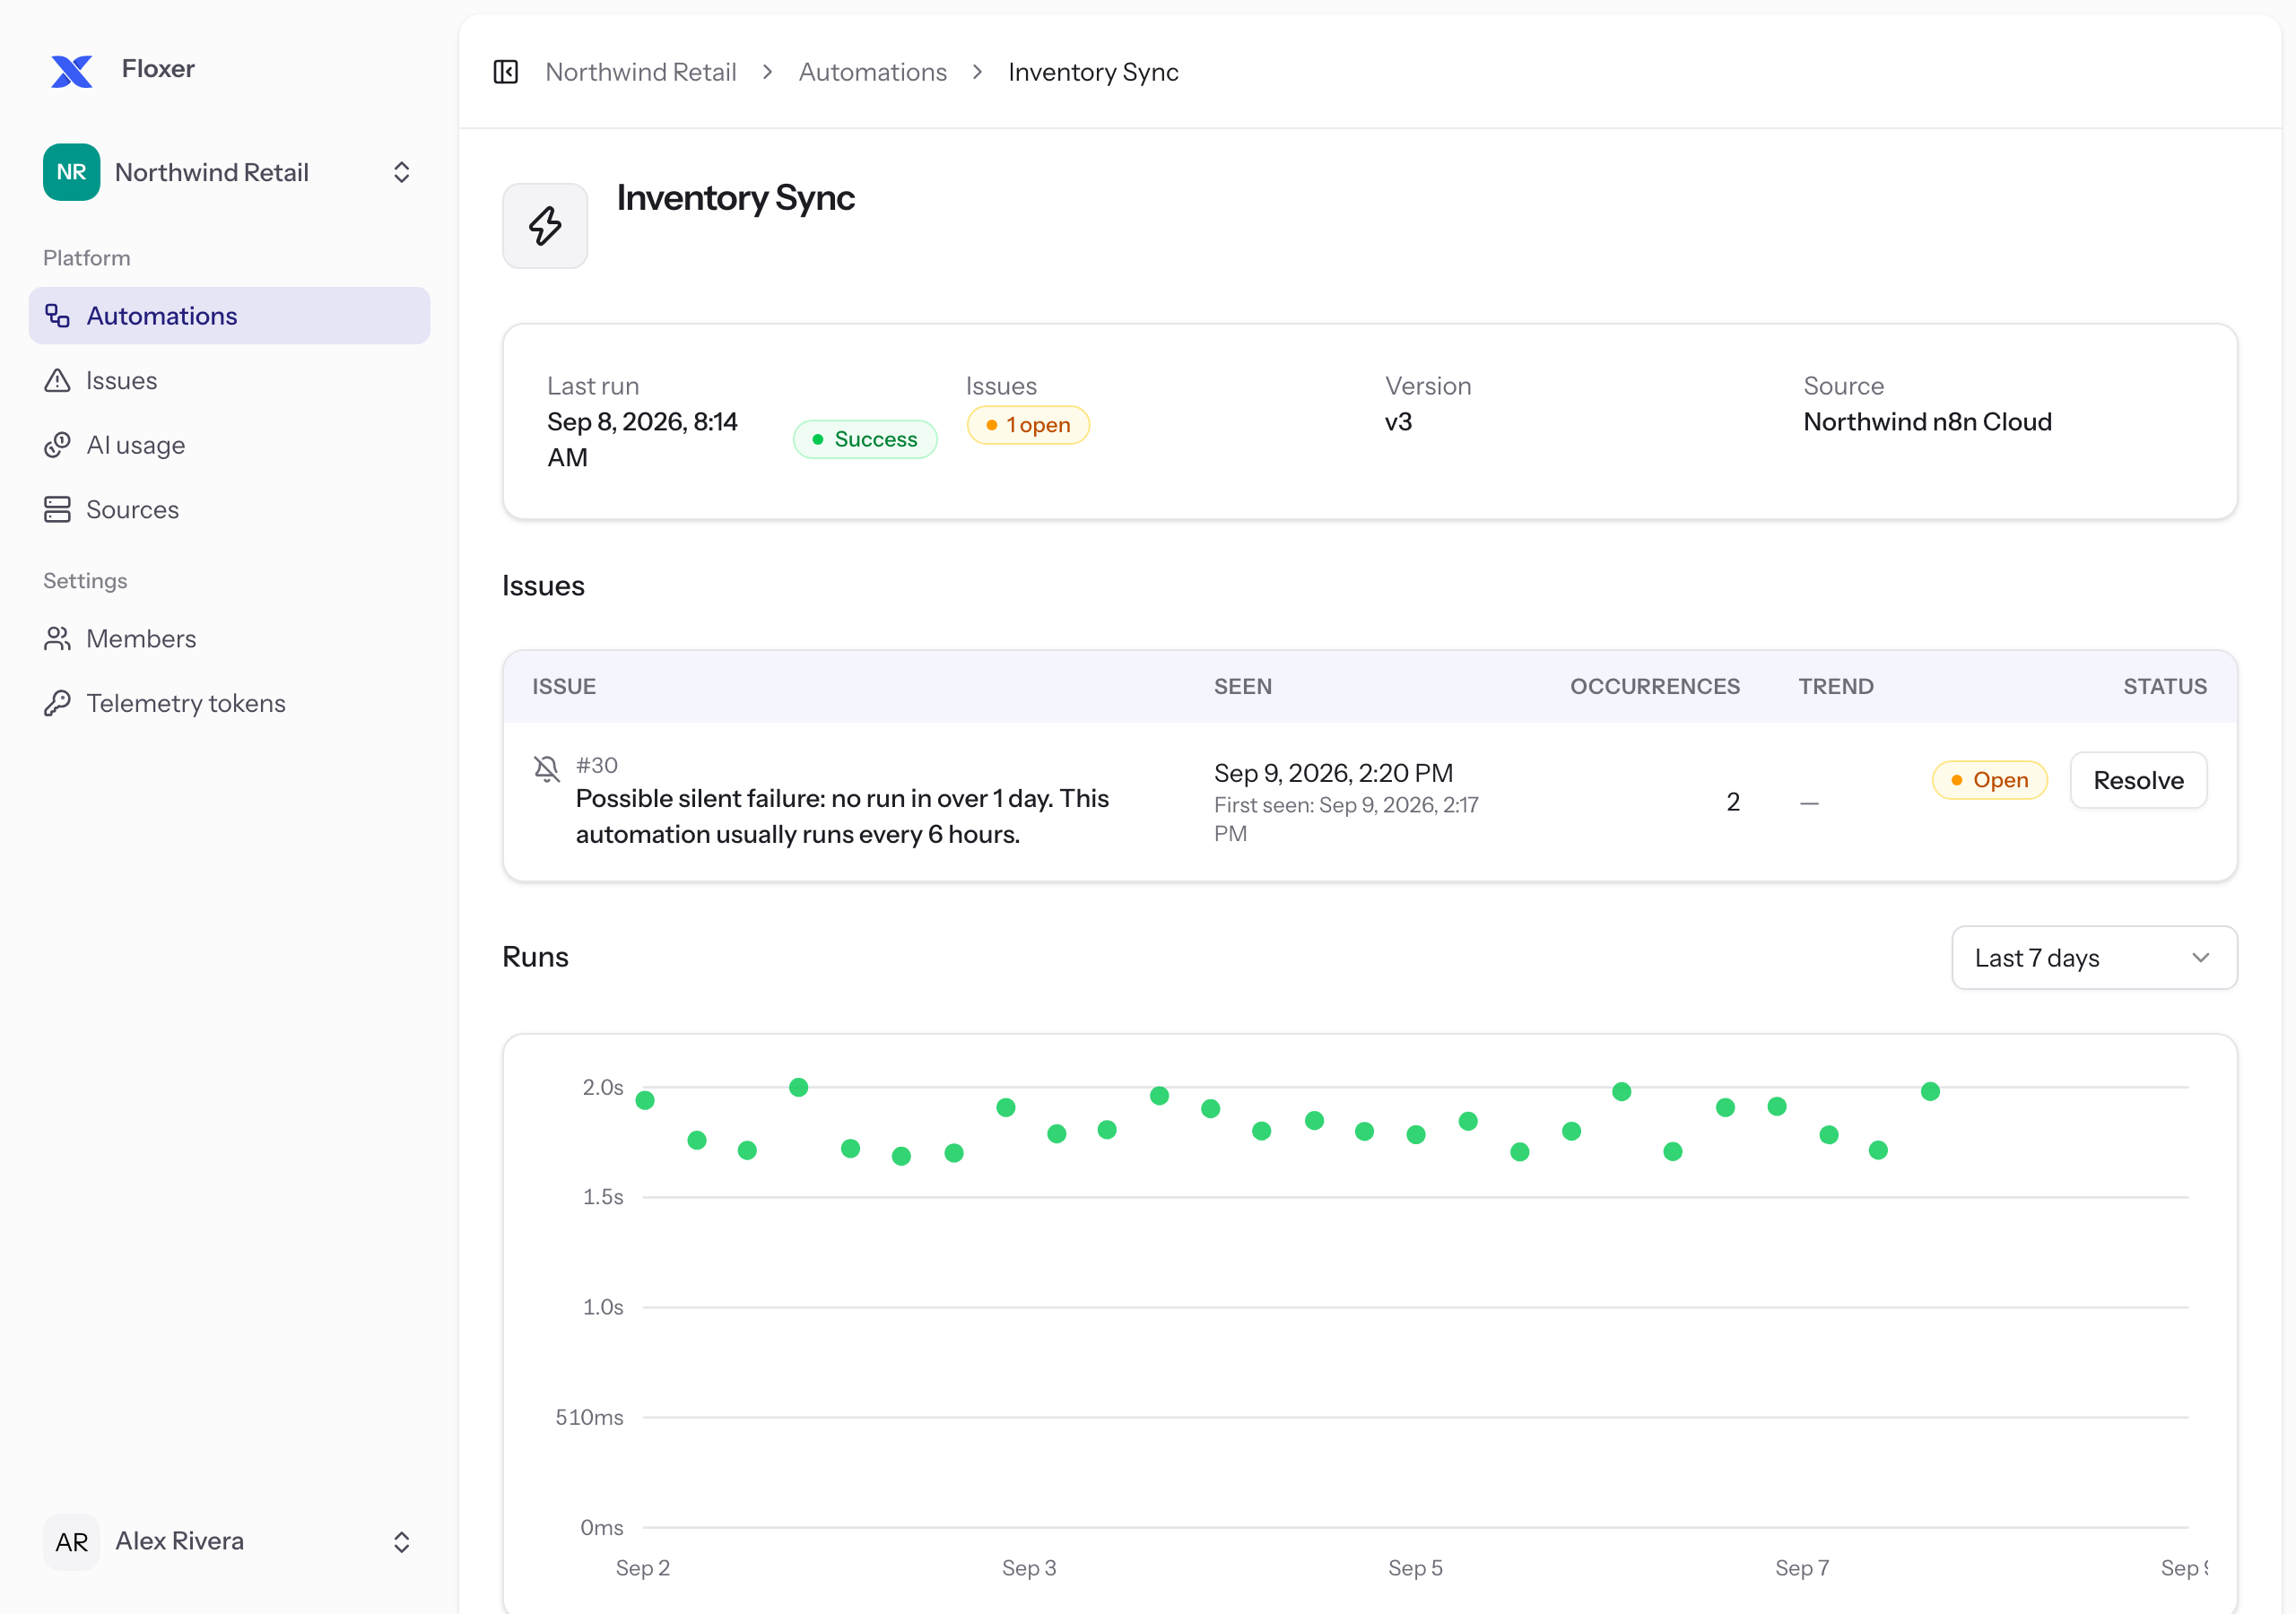
- Learns each automation's own cadence — flags a run that's actually late
- Auto-resolves once behavior is back to normal for a few runs in a row
- ●Runtime is 3.1× slower than usual
- ●AI cost per run is 84% above normal
- ●This automation usually runs every Monday. No run seen today.
- ●Run volume is much lower than usual
- ●Output dropped to 0 while the run still succeeded
n8n, Claude Agent, or anything that speaks OpenTelemetry
A Workspace issues one telemetry token that can authenticate ingest for several Sources at once — Source identity comes from the telemetry itself, not from which token sent it. Platform-specific quirks stay inside that platform's own adapter; Floxer's model never leaks them into your dashboard.
- Native n8n and Claude Agent support today
- Any custom OpenTelemetry/OTLP exporter works out of the box
- One token, many Sources — mix platforms freely in one Workspace